18 — Photic resonance Prospective · pre-specified
Driving the loop: the first resonance sweeps
Analysis basis 15 sweeps in 11 sessions (the LSD-labeled and the psilocybin session with three each) · dataset release 2026.10.10 · last recomputed in analysis release 4.26 · current
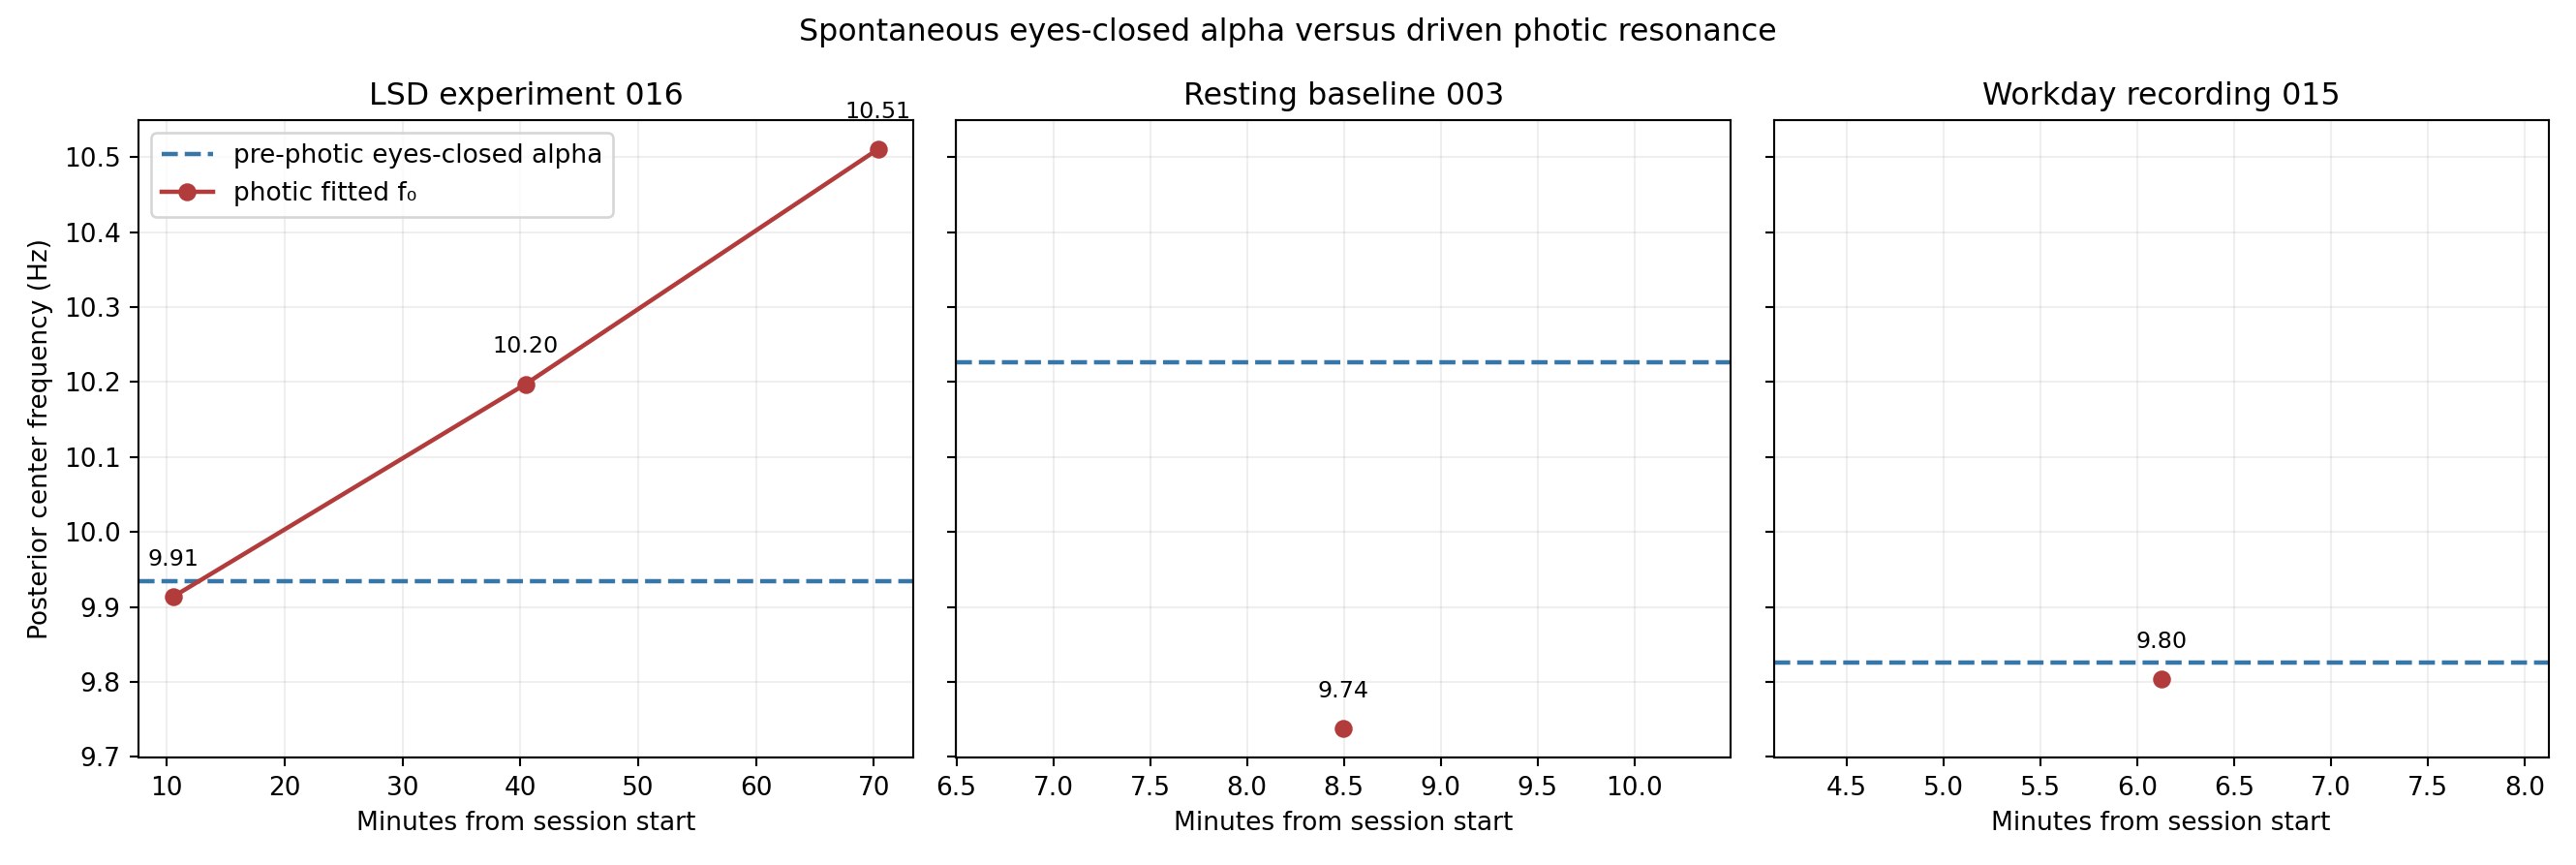
Fifteen flicker sweeps in eleven sessions: five in the three sessions this section was written on, and ten added in the October update, three of them in a psilocybin session with its own pre-dose sweep. The non-psychedelic resonance sat at 9.93, 9.75 and 9.72 Hz across the first three sweeps, within 0.21 Hz; the seven later ordinary sweeps that fit (r² ≥ 0.6) run from 9.57 to 10.24 Hz (SD 0.22 Hz over the seven), and the two that do not fit are shown with their r² (10.51 Hz in Workday recording 025 (r² 0.35); 11.65 Hz in Workday recording 027 (r² 0.36)). In the one LSD-labeled session the driven peak sat at 9.75–9.95 Hz before a dose of a known, small quantity and at 10.2–10.7 Hz forty minutes after it, by three independent estimators, and spontaneous alpha rose with it; the third sweep, at seventy minutes, is too noisy to place. The first sweep was pre-dose, so the session carries its own reference. One session, no placebo, so consistent with, not yet sufficient to establish, a psychedelic effect.
The claim, in five lines
- Observation
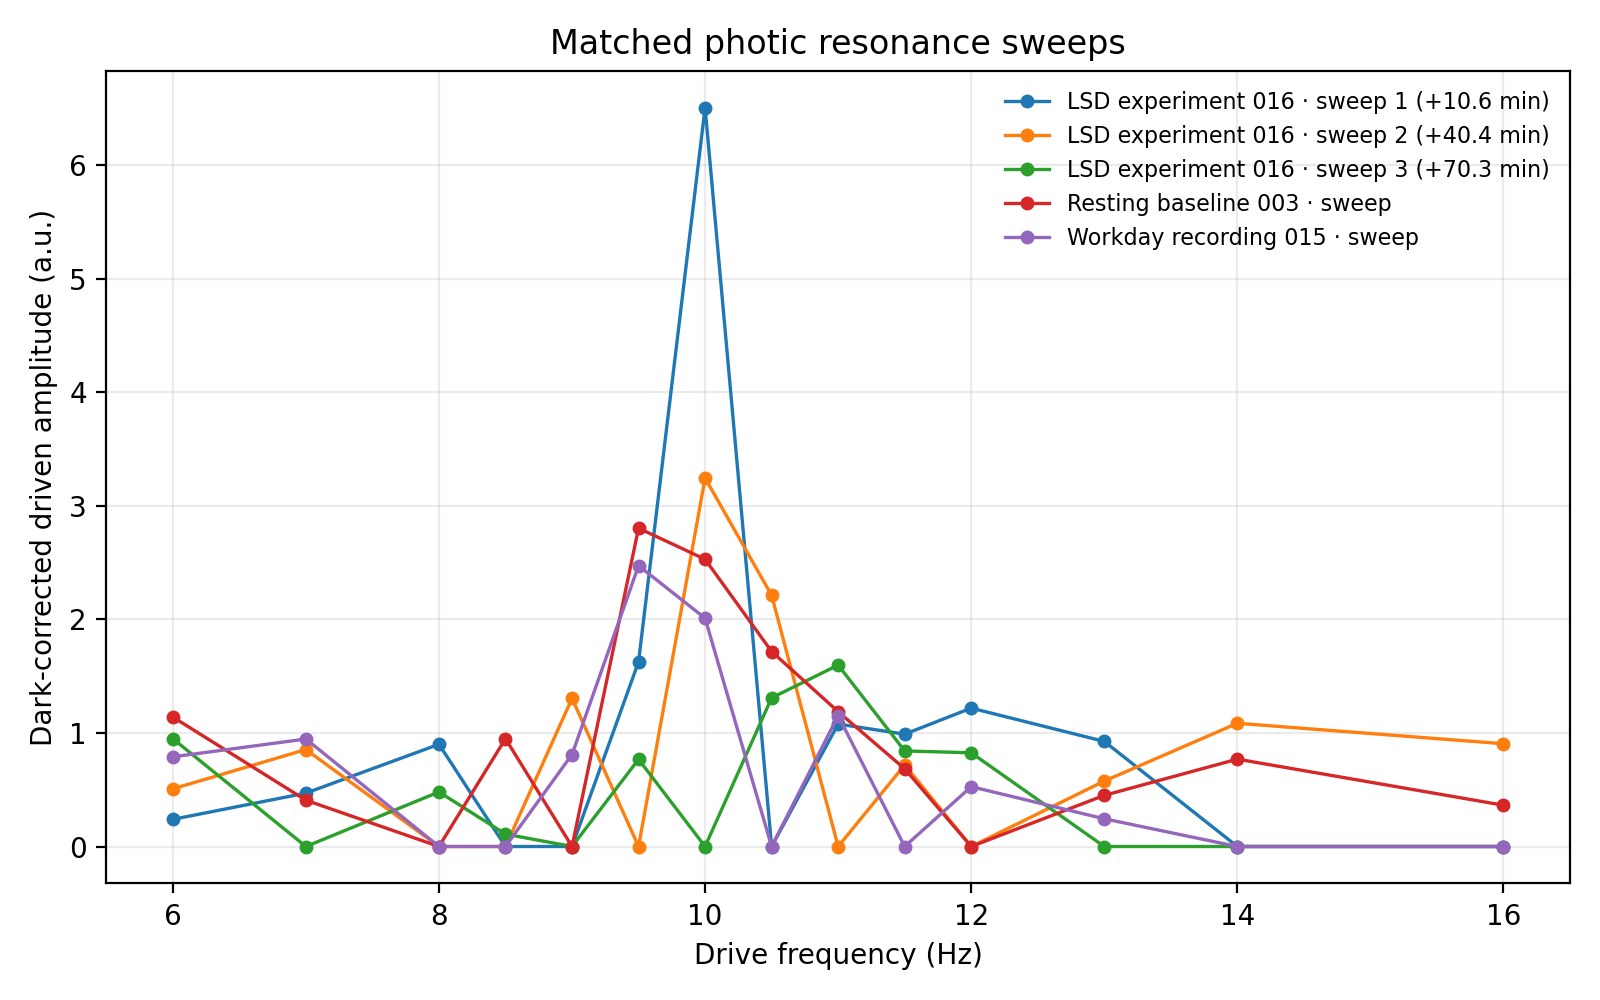
- Flicker from 6 to 16 Hz produces a resonance curve peaking at 9.7–9.9 Hz on non-psychedelic days; in LSD experiment 016 it peaked at 10.2–10.7 Hz forty minutes after the dose.
- Status
- 15 sweeps in 11 sessions; the non-psychedelic resonance reproduced across ten days; the upward shift is one LSD session, three estimators, third sweep unconstrained, and one psilocybin session with three sweeps showed no shift. Prospective, pre-specified (H1–H3; H5 has its first data point).
- Interpretation
- The effective alpha resonance of the visual system moved with the dose; within a thalamocortical resonator model this would correspond to a change in loop gain, although fitting such a model does not uniquely identify the mechanism.
- Alternatives
- Time in session, arousal and adaptation; the curve reflects retina, thalamus, cortex and montage together, not one loop in isolation; dose clock time was not logged.
- Discriminating test
- Repeat sessions with dose timing, a fine 0.05 Hz grid around the peak, and a matched non-psychedelic session of the same length.
What was done
Every session since v3 opens with a fixed block — 30 s settling, 120 s eyes open, 120 s eyes closed — and then runs the photic protocol of §18: a diffused LED panel in a sleep mask, 30 s dark, then fourteen flicker frequencies from 6 to 16 Hz in random order, 20 s on and 10 s off, with the order logged by the controller. The response at each frequency is the posterior signal-to-noise ratio at the drive frequency, minus the same ratio in the dark, and a damped-oscillator (Lorentzian) curve fitted to the fourteen points gives f0, the frequency of maximum response, and Q, its sharpness.
The eyes-open / eyes-closed block is the control the confound section (§16) has asked for since the first correction. It now exists in every new session, and it is used here to compare each session's spontaneous eyes-closed alpha with its driven f0.
Every sweep
| Session | Minute | f0 (Hz) | 95% interval | Grid peak | Q | 2f / f | Max SNR | Tremor ratio |
|---|
Download this table as CSV · Q is f0 divided by the full width at half maximum, reported only where the fitted width exceeds the 0.5 Hz stimulus spacing. Tremor ratio is the 8–12 Hz share of head-accelerometer power during the sweep.
Discussion
In every matched sweep the driven response rose to a single maximum inside the alpha band and fell away on both sides, with the fitted center within a quarter-hertz of the best grid point and the fit explaining 61–89% of the variance across the fourteen frequencies. Nothing resonated in theta, and the 13–16 Hz drives produced the weakest responses of all. The primary estimate of f0 throughout is a single damped-oscillator fit to the O1, O2 and P8 aggregate — the channels the analysis plan named. The median of separate fits to the four posterior channels, which adds P7, is quoted as a check; it never differs by more than 0.4 Hz.
The non-psychedelic calibration. Three sweeps without a psychedelic on board — the pre-dose sweep (9.93 Hz) and one on each of the two following days (9.75 and 9.72 Hz) — agree within 0.21 Hz, inside the ±0.3 Hz pre-specified as H2 and inside the 9.4–10.7 Hz window of H1. Their spontaneous eyes-closed peaks were 0.40 Hz apart, so the driven measure was the more repeatable of the two, which is what the protocol was built for. The one 0.5 Hz mismatch between driven and spontaneous peaks is on the resting day, whose spontaneous estimate rests on a 2.9-minute file and a block pooled across an application restart.
The LSD-labeled trajectory. Three sweeps: one before the dose and two after, at +11, +40 and +70 minutes from the start of the recording. Three independent estimators — the aggregate Lorentzian used throughout, a re-fit with the protocol's reference script, and an exact-frequency estimate bootstrapped within every block — give 9.93, 9.95 and 9.75 Hz pre-dose; 10.20, 10.67 and 10.50 Hz at +40 minutes; and 10.91, 10.00 and 9.37 Hz at +70. The second sweep sits 0.3–0.7 Hz above the first in every estimator, though one 10.5 Hz block carries most of its response; the third is unconstrained (bootstrap interval 8.7–11.0 Hz) and is set aside. The dose, a known, small quantity, followed the first sweep at about +18 minutes with the clock time unlogged, so the second sweep is at most 22 minutes post-dose — onset for LSD — and the rise it shows is consistent with, not sufficient to establish, a psychedelic effect.
Spontaneous alpha moved in step. In two-minute windows outside the sweeps, the 1/f-corrected posterior alpha peak rose across the 113 minutes the headset was worn (Spearman ρ = 0.80; independent recomputation 0.75–0.82 depending on the artifact mask), by roughly 1 Hz per hour. The rise was not a smooth ramp: resting windows sat near 9.3–9.7 Hz for the first 77 minutes and near 10.9–11.1 Hz after the third sweep. Beta power fell over the same interval (ρ = −0.72), so the faster alpha did not come with more beta — the pattern §11 describes for the harmonic. This is the within-session ramp that Correction 02 said had vanished at proper spectral resolution. In this session, at 0.125 Hz resolution and with the driven peak as an independent witness, it is present.
Retune or gain. The analysis plan set out three outcomes: the curve moves, the curve holds while amplitude rises, or the curve does not move at all. Here the curve moved and the amplitude rose: the maximum drive-bin signal-to-noise ratio was 46, 16 and 35 in the three LSD-labeled sweeps against 10 and 11 in the non-psychedelic ones. Retuning and gain are not either-or in this session; both changed. The third outcome — a resonance that ignores the state, which would have argued against any change in resonance — did not occur.
What one session cannot say. The comparison is the one the analysis plan asked for — the session's own pre-dose sweep, minutes apart on the same electrodes — and the resonance moved after the dose. What a single session cannot separate is the psychedelic from the hour: time in the session, slow changes in arousal and electrode contact, and expectancy all run in the same direction as the dose, and the two short non-psychedelic sessions show positive, non-significant frequency slopes of their own over a few windows. There was no placebo and no blinding. The statement the ledger carries is the one that holds: the driven resonance rose after a dose of a known, small quantity against the session's own pre-dose reference, consistent with, but not sufficient to establish, a psychedelic effect. A second dosed session with the same design is what turns it into one.
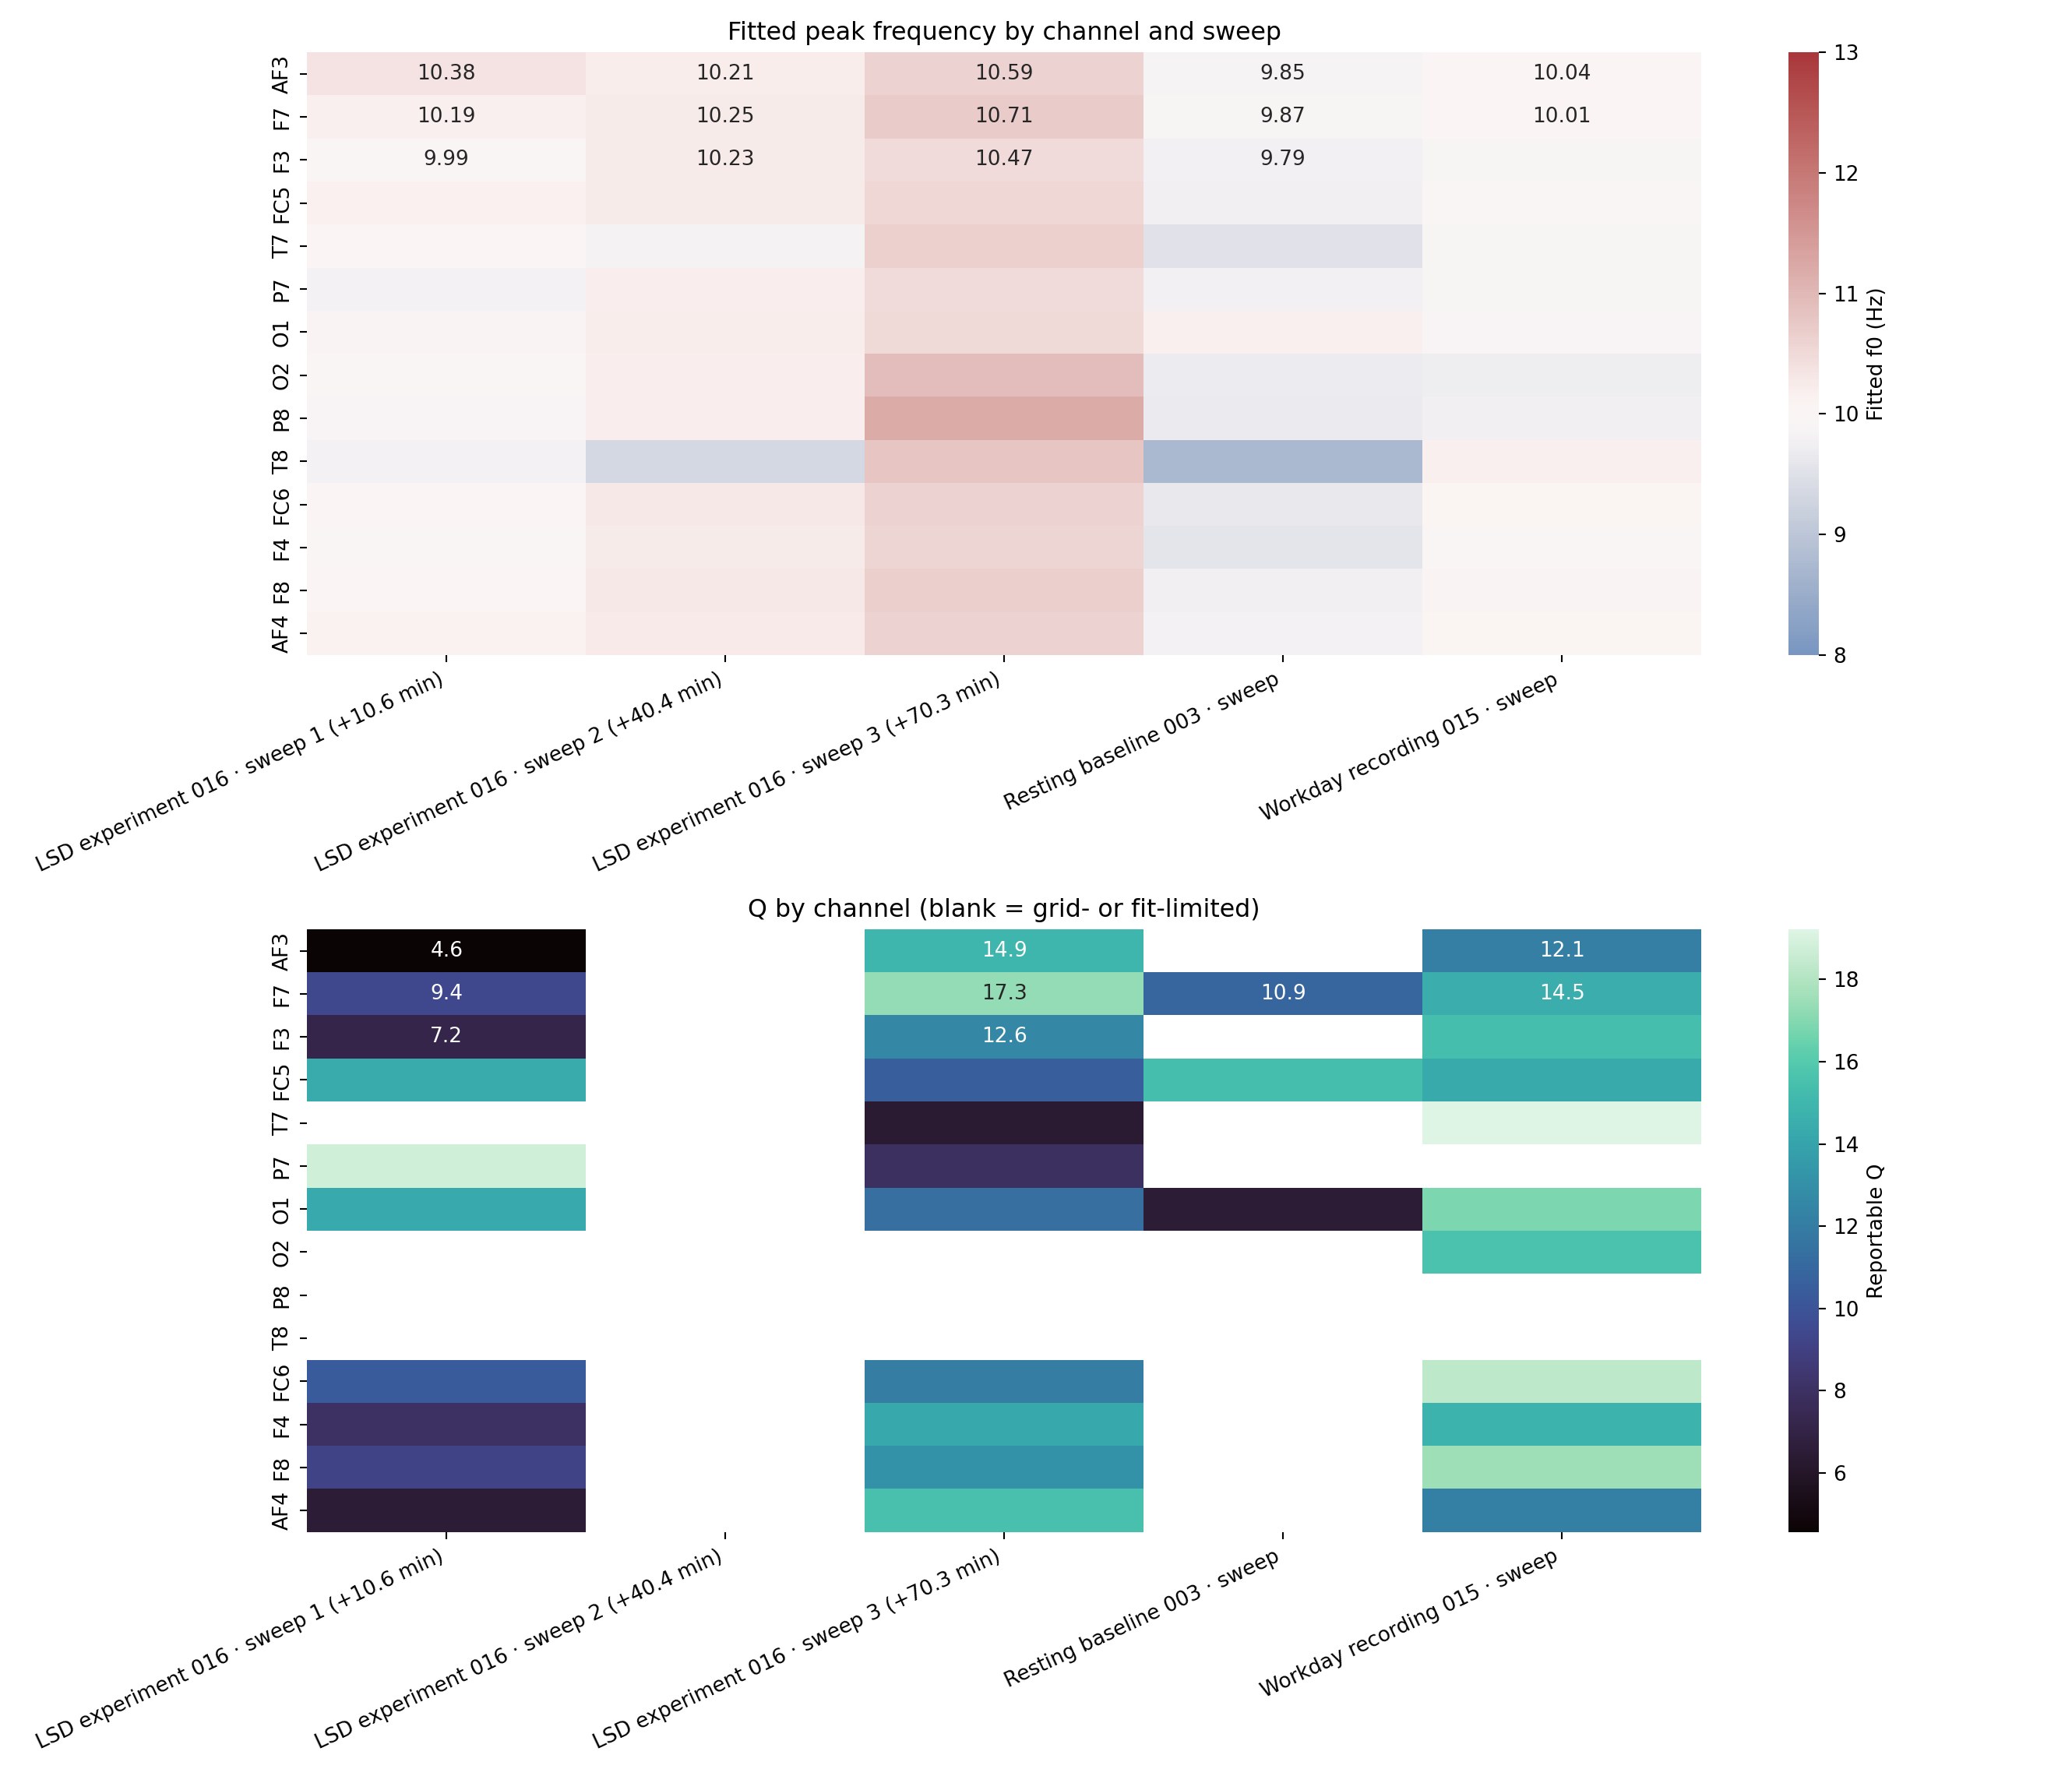
Sharpness is not resolved. With 0.5 Hz between stimulus frequencies and one 20 s block per frequency, a half-width narrower than about 0.25 Hz cannot be measured, and in four of the five original sweeps the fitted width pinned at the floor; across all fifteen, six resolve a width (Q 6 to 17) with no ordering by state. The one resolved width (the third LSD-labeled sweep, Q ≈ 10) belongs to the sweep with the poorest fit. Per-channel Q, where reportable, was 9–13 in LSD-labeled sweeps and 11–15 in non-psychedelic ones, and like-for-like posterior channels broadened rather than sharpened across the session. H4, that LSD raises Q, is unsupported, and the grid must be finer before it can be tested. The driven second-harmonic ratio (0.73, 0.61, 0.90 in the LSD-labeled sweeps; 0.55 and 0.62 non-psychedelic) overlaps between states, and the flicker is a square wave, so the stimulus contributes harmonics of its own.
The eye-state block did what it was added for. Posterior alpha rose on eye closure in 14 of 14 channels in ten of the eleven scored sessions, by 2.0× to 13.7×: 7.9× in the resting baseline, 3.7× at the desk, 2.2× under LSD, 3.5× before the psilocybin dose, ratios that move by 10–15% with the artifact screen. The exception is Daily-life recording 005, the morning after the psilocybin session, where posterior alpha fell on eye closure (0.62×, 1 channel up); it is reported, not corrected, and that session's block labels are not trusted. The LSD-labeled block was pre-dose, so it is a third non-psychedelic block; its low ratio comes from eyes-open alpha already being high in a dim room before an expected dose — setting, not pharmacology. §16 carries the rest.
Across the scalp. Driven f0 was near-uniform within each sweep (ranges of 0.1–0.7 Hz across the channels with a reliable fit): consistent with a common or highly coherent generator, as §06 found for spontaneous alpha, though scalp EEG cannot distinguish one source from several locked together. The strongest driven response was not always occipital — FC5 and AF3 led one LSD-labeled sweep — which on this montage is as likely reference, volume conduction or forehead muscle as a frontal generator. Head tremor was lower during the LSD-labeled sweeps than the non-psychedelic ones while f0 was higher, so the resonance is not an artifact of motion; the coincidence check pre-specified as H8 was not run.
The psilocybin session: no upward shift
The second compound to be swept. Psilocybin experiment 017 carried three sweeps on the archive protocol, one before the dose and two after (+23 and +45 minutes from the first), and the resonance did not move: the driven peak sat on the 10 Hz grid point in all three, with the fitted f0 at 10.65, 9.86 and 9.76 Hz. The pre-dose fit is poor (r² 0.26; its 30 s dark reference carried strong spontaneous alpha at 10–10.5 Hz, and the log-timed refit gives 9.97 Hz), the two post-dose fits are the best in the archive (r² 0.76 and 0.91, Q 16.6 and 13.2), and the second post-dose sweep has the largest drive-bin signal-to-noise ratio of all fifteen (50). The same session's spontaneous eyes-closed peak was 10.39 Hz, so the driven peak sat half a hertz below the spontaneous one, where under LSD it moved above it. H5, that the classes differ in how they move the resonance, has its first data point: one LSD session moved up by 0.6–1.0 Hz, one psilocybin session did not move. One session per compound, no placebo, dose unlogged to the minute for LSD; a difference between compounds is consistent with these two sessions and not established by them. The sweep the next day (Daily-life recording 005) sat at 10.24 Hz.
The ten October sweeps as a calibration. Nine of the ten peak at 10 Hz on the stimulus grid (9.5 Hz for two, 11.5 Hz for one), and the seven ordinary sweeps that fit run from 9.57 to 10.24 Hz on seven different days, a standard deviation of 0.22 Hz: the ±0.3 Hz reproducibility pre-specified as H2 now rests on nine sweeps rather than three, and holds. The two sweeps that do not fit (10.51 Hz in Workday recording 025 (r² 0.35); 11.65 Hz in Workday recording 027 (r² 0.36)) are weak sweeps with one reliable posterior electrode each; they are kept in the table with their r² and excluded from the calibration.
The pre-specified hypotheses
Pre-specified means that the hypotheses and their pass criteria were written down before the sweeps were analyzed. They were not lodged with a public registry, so the timing rests on this project's own dated records rather than on an independent timestamp.
| Hypothesis | Verdict | Evidence |
|---|---|---|
| H1 Non-psychedelic f0 lies within 9.4–10.7 Hz, near the spontaneous alpha peak | Supported | 9.93 (pre-dose), 9.75 and 9.72 Hz, all inside the window. Driven peak within 0.03 Hz of the spontaneous eyes-closed peak in two sessions and 0.5 Hz below it in the third, where the spontaneous estimate is least secure. |
| H2 Non-psychedelic f0 reproducible to ±0.3 Hz across three sessions (calibration, not a gate) | Supported | Three non-psychedelic sweeps in three sessions (one the pre-dose sweep of the LSD-labeled session): 9.93, 9.75, 9.72 Hz, range 0.21 Hz, SD 0.11 Hz, inside ±0.3 Hz. One sweep per session, so the within-session non-psychedelic spread is still unmeasured. |
| H3 LSD raises f0 by ≥ 0.3 Hz against the session's own pre-dose sweep | Supported in one session | Against the session's own pre-dose sweep (a known, small quantity): +0.27 Hz at ≤ 22 min post-dose (inside the undefined 0.15–0.30 band) and +0.6 to +1.0 Hz at ≤ 52 min. The aggregate fit of the third sweep fails the r² ≥ 0.7 rule; its posterior-median estimate (+0.60) does not. One session, no placebo: consistent with the hypothesis, not sufficient to establish it. |
| H4 LSD raises Q and the 2f/f harmonic ratio | Not supported at this resolution | Q unresolved on the 0.5 Hz grid in four of five sweeps; per-channel Q does not favor LSD, and like-for-like posterior channels broadened across the session. Harmonic ratios overlap (0.61–0.90 vs 0.55–0.62) and the flicker is itself a square wave. |
| H5 Psychedelic classes differ in how they move the resonance | First data point | LSD (one session) moved the resonance up by 0.6–1.0 Hz; psilocybin (one session, three sweeps) left it on the 10 Hz grid point. Consistent with a class difference, not sufficient for one. No ayahuasca or DMT sweep exists. |
| H6 Ayahuasca (exploratory) | No data | No ayahuasca sweep; the two October ayahuasca sessions were recorded without the photic protocol. |
| H7 Visual-pattern intensity peaks at the drive frequency nearest f0 | Not recorded | No subjective ratings were logged for any sweep. |
| H8 f0 is independent of head tremor | Partially supported | Tremor share was lower during the LSD-labeled sweeps while f0 was higher, which argues against contamination; the third sweep nonetheless carried the highest absolute 8–12 Hz accelerometer power, and the pre-specified coincidence check was not run. Five sweeps cannot test independence. |
Conclusions
- The sweep works on this rig. All five original sweeps, and eight of the ten added in October, produced a fittable resonance inside the alpha band, with the fitted center within a quarter-hertz of the best grid point and within 0.03–0.5 Hz of the same session's spontaneous eyes-closed peak. Nothing resonated in theta.
- The non-psychedelic resonance is 9.8 Hz, reproduced within 0.21 Hz across the first three sweeps on three days and, with the seven fitted October sweeps, within 9.57–10.24 Hz across ten days (SD 0.20 Hz) — more stable across days than the spontaneous peak. This is the calibration number for everything that follows, and it is the first driven estimate of the visual system's effective alpha resonance in this archive.
- In the one LSD-labeled session the resonance moved up after a dose of a known, small quantity, against the session's own pre-dose sweep, from 9.9 Hz to 10.5–10.9 Hz over an hour, and spontaneous alpha rose in step. The outcome that would have argued most strongly against a resonance change — a curve that does not move — did not occur.
- Under psilocybin the resonance did not move. Three sweeps in one session, one pre-dose: the driven peak stayed on the 10 Hz grid point and the fitted center fell slightly (10.65, 9.86, 9.76 Hz, the first poorly fitted). The LSD shift is not a property of every compound. One session each, so a lead for H5, not a result.
- Amplitude rose as well. Driven signal-to-noise was three to four times the non-psychedelic values, so this session does not separate retuning from gain; both changed.
- One session. The within-session pre-dose reference is the comparison the analysis plan asked for, and H3 is met at the third sweep. With one session, no placebo and the dose clock time unlogged, the trajectory is consistent with, but not sufficient to establish, a psychedelic effect; time in the session is the alternative a repeat can rule out.
- Sharpness is beyond the grid. Q is resolved in only six of fifteen sweeps; the claim that LSD sharpens the resonance is unsupported and untestable until the stimulus grid is 0.25 Hz near the peak or the blocks are longer.
- The eye-state block is now standard and reproduced 14-of-14-channel alpha reactivity three times. The block in the LSD-labeled session was pre-dose, so the acute sessions are still not eye-state annotated; its low ratio (2.2×) reflects high eyes-open alpha before the dose, not the psychedelic.
- Two non-psychedelic photic sessions reset two v2 associations. They exceed the psychedelic medians on every traveling-wave measure and one reaches the LSD median on harmonic bicoherence, which moves both from "tracks the psychedelic label" toward "tracks organized eyes-closed alpha, with or without a psychedelic". Details in §12 and §11.
- Before phase 2: the dose clock time logged to the minute; a pre-dose sweep inside every dosed recording, as here; a 0.25 Hz grid around the peak; three non-psychedelic sessions with repeated sweeps; the r² rule applied as pre-specified; one primary estimator (the aggregate O1/O2/P8 fit) declared in advance; and a wave-vector analysis of the driven windows to calibrate the compass in §12.
Verification and limits
Independent refit (v3, September 2026): a damped-oscillator curve was refitted to each of the five published amplitude curves from the resonance_curve.csv files, with 600 residual-bootstrap resamples per sweep. Every fitted center agrees with the published f₀ to within 0.05 Hz, and the amplitude transform (square root of drive-bin SNR minus dark-block SNR, floored at zero) reproduces the published curves exactly. The 95% intervals in the table come from this refit.
Width: in four of five sweeps the fitted half-width pins at the fit floor, so Q is reported as unresolved there rather than as the 22–25 the source table carries. The one resolved width (third LSD-labeled sweep, Q 10.4) belongs to the sweep with the poorest fit (r² 0.61), below the 0.7 the analysis plan set for the primary analysis; it is shown, flagged.
Estimator: the source analysis quotes three different ‘posterior f₀’ values per sweep (aggregate O1/O2/P8 fit; median of four posterior channel fits; median of all reliable channels). This page uses the aggregate fit as primary and the four-channel median as the check; they differ by up to 0.4 Hz on the third LSD-labeled sweep.
Eye-state baselines were recomputed from the raw files without an artifact screen: every alpha peak agrees within 0.07 Hz. The eyes-closed / eyes-open power ratios are screen-dependent (unscreened 1.91×, 7.15×, 3.73× against the reported 2.21×, 7.91×, 3.69×), so they are quoted as an ordering.
The resting-baseline eyes-closed block is pooled from 25 s before an application restart and 95 s beginning 2.5 minutes later; the eyes-closed state of the second piece is inferred from the timing, not logged. Its sweep minute (+8.5) is wall-clock from the first file and includes the gap; it falls 3.3 minutes into the second file.
LSD experiment 016: only the first 113 minutes (113.6 wall-clock, because of dropped samples) were worn; the headset came off at 113.6–115.5 min and the cut is safe. Artifact screening used the consensus quality-and-amplitude fallback (88% retained) where the standard mask retains 80%; the within-session frequency rise reproduces under both (ρ 0.75–0.82). Sweep windows (20% of the interval) carry flicker-locked peaks and are excluded from the resting-window trend; excluding them slightly steepens it.
The dose for LSD experiment 016 was recorded (a known, small quantity, taken after the first sweep) but its clock time was not, so minutes-since-dose are approximate and H3 is scored against the first sweep as the pre-dose reference. Subjective ratings, the head-support flag and the tremor coincidence check pre-specified for H7 and H8 were not recorded.
Whole-recording metrics for Resting baseline 003 (part 2) and Workday recording 015 are 63% and 40% flicker stimulation; they are not resting-state or office comparators and are excluded from the rest and office contrasts elsewhere on this page.